Male
Female
Customize Parameters
Heat map
dPCR
1.
2.
3.
4.
5.
6.
7.
8.
9.
10.
11.
12.
13.
14.
15.
16.
17.
18.
19.
20.
21.
22.
23.
24.
25.
26.
27.
28.
29.
30.
31.
32.
33.
34.
35.
36.
37.
38.
39.
40.
41.
42.
1.
2.
3.
4.
5.
6.
7.
8.
9.
10.
11.
12.
13.
14.
15.
16.
17.
18.
19.
20.
21.
22.
23.
24.
25.
26.
27.
28.
29.
30.
31.
32.
33.
34.
35.
36.
37.
38.
39.
40.
41.
42.
43.
44.
45.
46.
47.
48.
49.
50.
51.
52.
53.
54.
55.
56.
57.
58.
59.
60.
61.
62.
63.
64.
65.
66.
67.
68.
69.
70.
71.
72.
73.
74.
75.
76.
1.
2.
3.
4.
5.
6.
7.
8.
9.
10.
11.
12.
13.
14.
15.
16.
17.
18.
19.
20.
21.
22.
23.
24.
25.
1.
2.
3.
4.
5.
6.
7.
8.
9.
10.
11.
12.
13.
14.
15.
16.
17.
18.
19.
20.
21.
22.
23.
24.
25.
26.
27.
28.
29.
30.
31.
32.
33.
34.
35.
36.
37.
38.
39.
40.
41.
42.
43.
44.
45.
46.
47.
48.
49.
50.
51.
52.
53.
54.
55.
56.
57.
58.
59.
60.
61.
62.
63.
64.
65.
66.
1.
2.
3.
4.
5.
6.
7.
8.
9.
10.
11.
12.
13.
14.
15.
16.
Female not applicable to this data set
1.
2.
3.
4.
5.
6.
7.
8.
9.
10.
11.
Female not applicable to this data set
1.
2.
3.
4.
5.
6.
7.
8.
9.
10.
11.
12.
13.
14.
15.
16.
17.
18.
19.
20.
Female not applicable to this data set
Human Heat Map Chart
Mouse Heat Map Chart
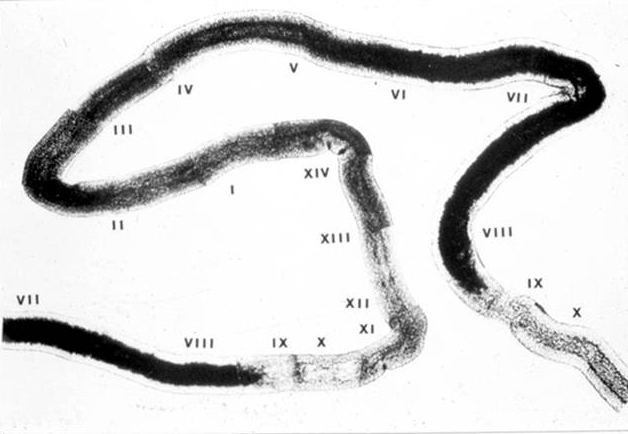
Rat Spermatogenic Heat Map Chart
 Image courtesy of Dr. William W. Wright
(John Hopkins University)
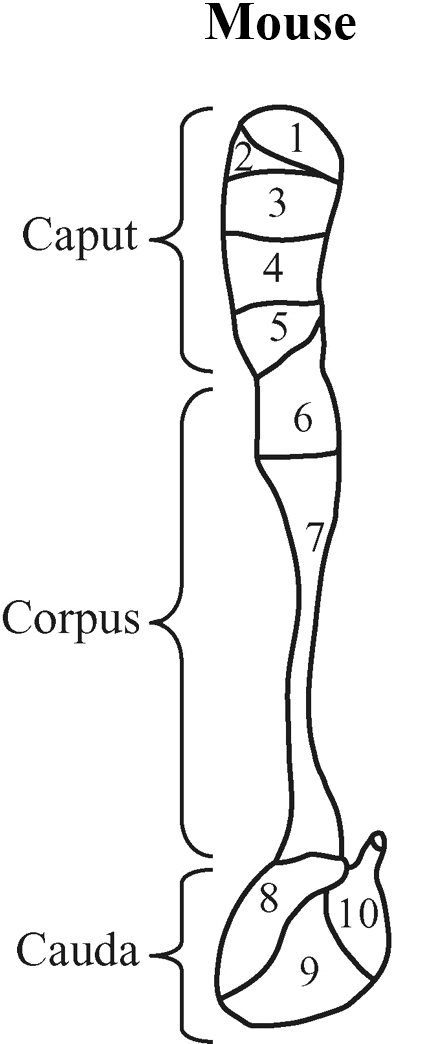
Mouse Epididymal Heat Map Chart

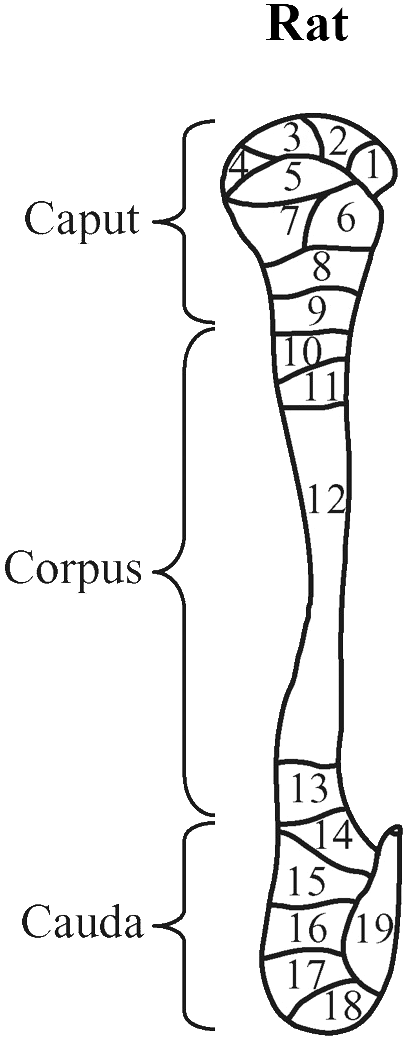
Rat Epididymal Heat Map Chart

Human Reprodutive and Non-Reproductive Tissue and Cells Bar Graph (RNA-seq)
Mouse Reprodutive and Non-Reproductive Tissue and Cells Bar Graph (RNA-seq)
Previously Identified as Male Reproductive Tract-Specific:
| Species | Ensembl ID | PMID | Affymetrix ID | Author | Gene Symbol |
|---|
